Have you ever wanted to build your own IoT-based Weather Monitoring Station? Imagine monitoring real-time temperature, humidity levels, atmospheric pressure, rainfall detection, air quality index (AQI), and more—right from your local network. With the power of the Arduino UNO R4 WiFi, you can create a dynamic weather dashboard web page that displays all your environmental data in real-time without relying on third-party cloud services.
No need to stress about complicated cloud setups or costly subscription plans. This DIY IoT Weather Station project only requires a few environmental sensors and the versatile Arduino UNO R4 WiFi board. It blends IoT, web development, and embedded programming, making it an ideal IoT project for beginners, students, and tech enthusiasts interested in smart weather systems, Arduino projects, and real-time data monitoring.
If you are new to Arduino UNO R4, then I strongly recommend that you go through this “Getting Started with Arduino UNO R4 & Arduino IoT Cloud” tutorial before proceeding.
Table of Contents
- What is an IoT-Based Weather Monitoring System?
- Block Diagram
- Components Required
- Circuit Diagram
- Hardware Pinout
- Hardware Setup and Connections
- Arduino Code Explanation
- Webpage HTML Code
- Flash Code into Arduino
- Working Demonstration
- GitHub Repository with Code and Circuit
- Similar IoT-Based Weather Monitoring Projects
What is an IoT-Based Weather Monitoring System?
An IoT-Based Weather Monitoring System uses sensors to collect real-time environmental data like temperature, humidity, and air pressure. It transmits the data to the cloud using IoT protocols such as Wi-Fi or LoRa. Users can access this information remotely via the web or mobile apps. This system helps in accurate forecasting, environmental research, and smart agriculture.
This Arduino Weather Monitoring System Project is very helpful in getting to know about your surrounding weather status from indoors. What makes this project different from others is that it gives you the advantage of fully customizing the local webpage user interface based on your creativity, whereas you can’t get this level of flexibility from the cloud platforms.
Block Diagram
The image below shows the weather monitoring system using an IoT block diagram. Let's understand how it works by splitting it into three sections
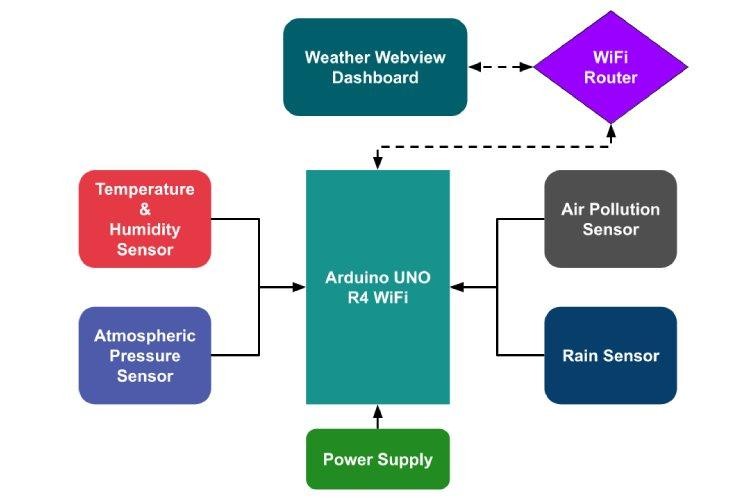
Gathering The Data From The Environment
This system uses a wide range of environmental sensors to capture the weather key parameters like temperature, humidity level, Atmospheric pressure, AQI Index, and Rainfall status continuously and send that data to Arduino through serial communication protocols as well as Normal Analog and Digital signals.
Serving The Locally Accessible Webpage
After getting the weather data from the environmental sensors, Arduino creates the local webpage that displays the sensor data by turning itself into a mini local web server. This means you can know weather data from a phone, tablet, or computer by simply connecting to the same network where the Arduino is connected.
Dynamically Updating The Webpage for Live Updates
Arduino-served Webpage keeps on refreshing the data dynamically, so you’ll always see the latest weather info. Whether the temperature rises, the humidity changes, or the Rain is falling, you will see instantly on your device. No need to manually refresh the webpage every time.
Components Required
Here are the components needed to build an Arduino Weather Monitoring System. Let’s see what things we need to build it.
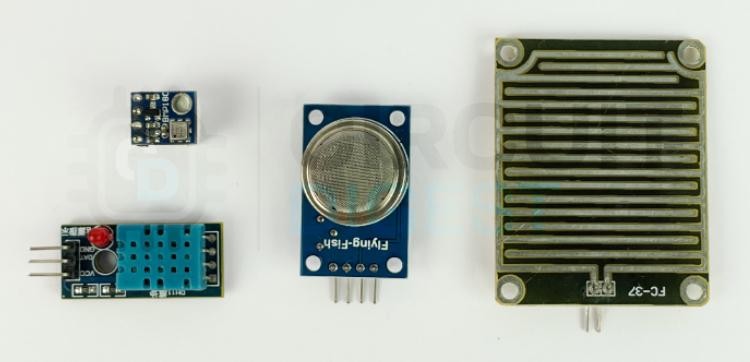
Arduino UNO R4 WiFi
BMP180 Barometric Pressure Sensor
DHT11 Temperature & Humidity Sensor
MQ135 Air Monitoring Sensor
Rain Sensor with Sensor Module
Breadboard
Connecting Wires
As you can see from the above components list, we will be using 4 different sensors to read various parameters like temperature, humidity, pressure, air quality, rain status, etc from the atmosphere. If you are a complete beginner with these sensors, check out the BMP180 tutorial, DHT11 Tutorial, MQ135 Tutorial, and Rain Sensor tutorial to understand how these sensors work and how you can use them with Arduino.
Circuit Diagram for Arduino-Based Weather Monitoring System

In the above image, you can find the circuit diagram of our Weather Monitoring System using Arduino. This circuit diagram helps turn our scattered electronic components found on the workbench into a functional Mini Weather Station.
As you can see, I am using a wide variety of sensors here for measuring each weather parameter, like
BMP180 Sensor - used for measuring the Atmospheric pressure. If the pressure is High means “Clear, sunny weather!” and if the pressure is low, it means “Rainy or stormy weather!”
DHT11 Sensor - used for measuring Temperature and Humidity. Here, temperature tells “How warm or cool the Air is” and humidity tells “How much water vapour is in the Air”.
MQ135 Sensor - used for measuring the Pollutants present in the Air. Here, monitoring the AQI(pollutant level) is important for health reasons, especially if we have asthma or lung allergies. (Note, it is not accurate, but might work well in indoor/outdoor environments)
Rain sensor - used for detecting whether it’s currently raining or not.
The Arduino UNO R4 WiFi collects all of this sensor data and makes the live data reflected on the Local Webpage instantly.
Hardware Pinout of IoT Weather Monitoring System
To make the hardware connection easy to understand, we have given a connection mapping below that explains the connection between your Arduino board and the various environmental sensors.
MQ135 Sensor and Arduino
DHT11 Sensor and Arduino
BMP180 Sensor and Arduino
Rain Sensor and Arduino
Hardware Setup of Weather Monitoring System using Arduino
Here is the complete hardware that was built from using the above circuit diagram as a blueprint
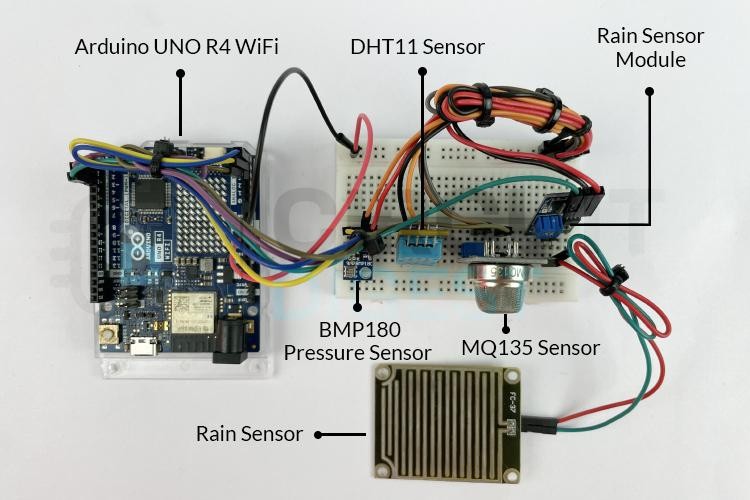
For power supply, you can either power it through the 12V DC jack port or through the USB port.
Arduino Code for IoT-based Weather Monitoring System
Before jumping into the code explanation, I will give you a short overview of this code. First of all, this code, ensures our Arduino UNO R4 WiFi is connected to our Local Access point. After that, it starts to serve the dynamic webpage by acting as a local web server.
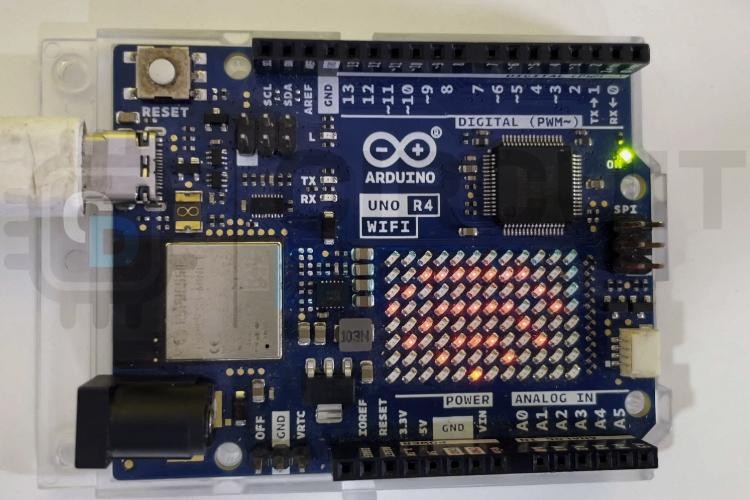
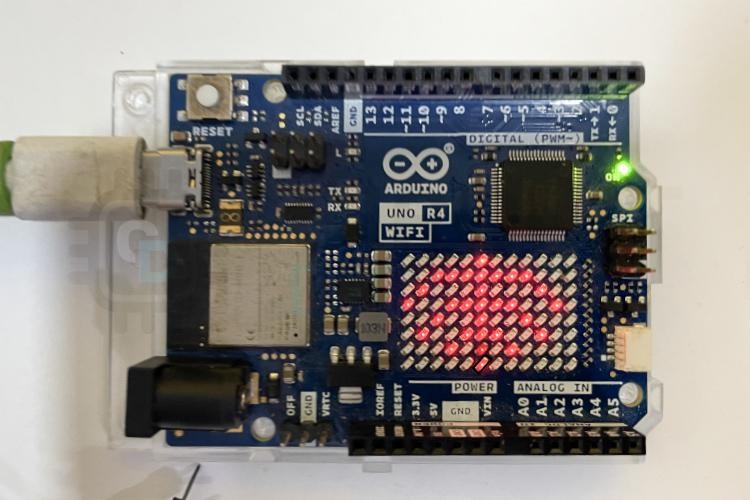
At the same time, it continuously retrieves data from the sensor every second and makes that data reflect on that dynamic webpage with a graphical chart format. It also utilizes the built-in 12x8 LED matrix for displaying the connection status. It ensures Arduino automatically connects to the Hotspot whenever it gets disconnected.
I hope you get a clear overview. Let’s move on to a step-by-step code explanation.
Including Header Files for Prebuilt Functions
#include <Adafruit_BMP085.h>
#include <Adafruit_Sensor.h>
#include <DHT.h>
#include <DHT_U.h>
#include "Arduino_LED_Matrix.h"
#include "WiFiS3.h"
Here,
1.Adafruit_BMP085.h && Adafruit_Sensor.h
- It helps in interfacing with the BMP180 using simpler I2C APIs as well to parse the Humidity data.
It is used for establishing a connection with the DHT11 sensor through its serial communication protocol with ease.
3.Arduino_LED_Matrix.h
Arduino UNO R4 built-in 8x12 LED matrix can be easily customizable using its provided prebuilt routines.
4.WiFiS3.h
We know Arduino UNO R4 supports WiFi features, where this library comes in handy for easy WiFi setup and configuration.
Note “Arduino_LED_Matrix.h” and “WiFiS3.h” come along with the board support package of Arduino UNO R4 WiFi. So, we don’t need to install it separately.
You can easily get this library by clicking the appropriate header file name.
After downloading the ZIP file from the GitHub repo, you can install it either through the Arduino IDE, by going to Sketch -> Include Library -> Add ZIP Library and selecting the downloaded ZIP file, or by simply extracting the ZIP file into the Arduino library folder.
Macros for Sensor Pin Mapping
#define Rain_SensorPin 3
#define Air_SensorPin A0
#define Temp_Hum_SensorPin 2
Here, I used macros to hold the pin data of the Rain sensor, DHT11 sensor, and MQ135 sensor, where the sensor is going to connect to the appropriate pin of the Arduino.
Creating Objects for Sensor, WiFi & LED Matrix
This step is about creating objects for the sensor, WiFi, and LED matrix to easily use the prebuilt APIs.
DHT_Unified dht(Temp_Hum_SensorPin, DHT11);
Adafruit_BMP085 bmp;
WiFiServer server(80);
ArduinoLEDMatrix matrix;
Here, I am creating a new object for the DHT11 sensor, and the BMP180 sensor to initialize it properly by passing its pin details and the type of sensor used.
Whereas the creation of a server() object to make use of the WiFi module’s Web Server capability and a matrix object to control the built-in LED matrix with ease by utilizing its class specific API’s.
Holding Important Data Using Global Variables
const uint32_t wifi_connected[] = {
                               0x3f840,
        0x49f22084,
        0xe4110040
};
const uint32_t no_wifi[] = {
                               0x403f844,
        0x49f22484,
        0xe4110040
};
Here, these two array variables, wifi_connected[] && no_wifi[] hold the hexadecimal code, which is vital for bringing up the wifi connected symbol and wifi disconnected symbol on Arduino UNO R4’s builtin 12x8 LED Matrix.
char ssid[] = "Semicon Media";
char pass[] = "xxxxxxxxxxxx";
ssid[] and pass[] character array is used to hold your WiFi Router password. So that your Arduino UNO R4 can connect to this local network. Don’t forget to replace it with your Wifi router credentials.
float temperature = 0.0, humidity = 0.0, pressure = 0.0;
int AQI = 0, rainfall = 0;
These variables are used to hold the weather parameter info like temperature, humidity, pressure, AQI, and rainfall status, which was obtained from its respective sensors.
unsigned long lastSensorUpdate = 0;
unsigned long lastWiFiCheck = 0;
Here, these two variables act as status variables, where “lastSensorUpdate” keeps a record of the last time the weather data was fetched from the sensor, and “lastWiFiCheck” tracks the last time the Wi-Fi status was checked.
wifi_connect() Function
wifi_connect() Function establishes the initial connection to the specified WiFi network.
void wifi_connect(){
 if (WiFi.status() == WL_NO_MODULE) {
   Serial.println("Communication with WiFi module failed!");
   matrix.loadFrame(no_wifi);
   while (true);
 }
 Serial.print("Connecting to WiFi...");
 matrix.loadSequence(LEDMATRIX_ANIMATION_WIFI_SEARCH);
 matrix.play(true);
 delay(6000);
 while (WiFi.begin(ssid, pass) != WL_CONNECTED) {
   Serial.print(".");
   delay(1000);
 }

 matrix.loadFrame(wifi_connected);

 Serial.println("\nConnected to WiFi!");
 Serial.print("IP Address: ");
 Serial.println(WiFi.localIP());
}
The wifi_connect() function is used for making a wifi connection with the authorized hotspot using its wifi credentials details.
While trying to connect to the hotspot, it brings a wifi connection animation on the built-in 12x8 LED matrix, to indicate the board is trying to connect to the internet. Later, it brings out a stable WiFi symbol after successful connection with the Hotspot.
wifi_reconnect() Function
wifi_reconnect() Function handles automatic reconnection to the network if the WiFi connection is lost.
void wifi_reconnect(){
   Serial.println("Wifi Reconnecting........");
   matrix.loadFrame(no_wifi);
   delay(6000);
   wifi_connect();
}
This wifi_reconnect() gets used when we need to re-establish the connection between the Arduino and the Hotspot after getting lost.
Whenever the connection gets lost, it brings out the “No Internet” symbol on the LED matrix and tries to connect again by calling out the wifi_connect() function.
read_sensor_data() function
read_sensor_data() function retrieves real-time data from the connected sensors.
void read_sensor_data(){
   sensors_event_t event;
   dht.temperature().getEvent(&event);
   temperature = event.temperature;
   dht.humidity().getEvent(&event);
   humidity = event.relative_humidity;
   pressure = bmp.readPressure() / 100.0; // Convert Pa to mbar
   int mq135Raw = analogRead(Air_SensorPin);
   float mq135PPM = mq135Raw * (5.0 / 1023.0) * 200.0; // Convert raw value to PPM
   AQI = map(mq135PPM, 0, 500, 0, 300); // Convert PPM to AQI (adjust as needed)
   rainfall = digitalRead(Rain_SensorPin) == HIGH ? 0 : 1;
   Serial.println("-------------------------");
   Serial.println(temperature);
   Serial.println(humidity);
   Serial.println(rainfall);
   Serial.println(pressure);
   Serial.println("-------------------------");
}
Here, the read_sensor_data() function is used to fetch the weather parameter data from the respective sensors by utilizing the sensor-specific APIs. After collecting data, it does unit conversions like converting pressure from Pa to mbar & raw air sensor value to PPM and makes it to store in respective global variables.
send_json_data() function
send_json_data() function sends real-time JSON data to the user's web browser.
void send_json_data(WiFiClient &client) {
 client.println("HTTP/1.1 200 OK");
 client.println("Content-Type: application/json");
 client.println("Connection: close");
 client.println();

 String json = "{\"temperature\":" + String(temperature) +
               ",\"humidity\":" + String(humidity) +
               ",\"pressure\":" + String(pressure) +
               ",\"aqi\":" + String(AQI) +
               ",\"rainfall\":" + String(rainfall) + "}";

 client.println(json);
}
The send_json_data() function is responsible for fetching the weather data from the global variables and sending weather data from the Arduino to a connected client(Browser) in JSON format over WiFi.
The response contains the weather data in a structured format, making it easy for the client to parse and display.
send_web_page() function
The function serves the dynamic web page directly to the user's web browser.
void send_web_page(WiFiClient &client) {
// Send HTTP headers
client.println("HTTP/1.1 200 OK");
client.println("Content-Type: text/html");
client.println("Connection: close");
client.println();
// Use raw string literal for HTML content
const char* html = R"rawliteral(
<!DOCTYPE html>
<html lang='en'>
<head>
<meta charset='UTF-8'>
<meta name='viewport' content='width=device-width, initial-scale=1.0'>
<title>Weather Dashboard</title>
<style>
body { font-family: Arial, sans-serif; background: #f4f4f4; color: #333; text-align: center; padding: 20px; }
h1 { font-size: 2rem; color: #0077cc; }
.container { max-width: 900px; margin: auto; }
.data-container { display: flex; flex-direction: column; gap: 10px; }
.data-row { display: flex; justify-content: space-between; align-items: center; }
.data-card { background: #fff; padding: 15px; border-radius: 8px; box-shadow: 0 4px 8px rgba(0, 0, 0, 0.1); flex: 1; margin: 5px; text-align: center; }
.graph { background: #fff; padding: 15px; border-radius: 8px; box-shadow: 0 4px 8px rgba(0, 0, 0, 0.1); margin-top: 15px; }
canvas { width: 100%; height: 400px; }
</style>
</head>
<body>
<h1>Weather Dashboard</h1>
<div class='container'>
<div id='weather' class='data-container'></div>
<div class='graph'><canvas id='combinedGraph'></canvas></div>
</div>
<script src='https://cdn.jsdelivr.net/npm/chart.js'></script>
<script>
const ctxCombined = document.getElementById('combinedGraph').getContext('2d');
// Create a single graph with both temperature and humidity
const combinedChart = new Chart(ctxCombined, {
type: 'line',
data: {
labels: [],
datasets: [
{
label: 'Temperature (°C)',
data: [],
borderColor: '#ff5733',
backgroundColor: 'rgba(255, 87, 51, 0.2)',
fill: true,
tension: 0.4,
pointRadius: 3
},
{
label: 'Humidity (%)',
data: [],
borderColor: '#2196f3',
backgroundColor: 'rgba(33, 150, 243, 0.2)',
fill: true,
tension: 0.4,
pointRadius: 3
}
]
},
options: {
responsive: true,
maintainAspectRatio: false,
animation: false,
scales: {
x: { title: { display: true, text: 'Time' } },
y: {
beginAtZero: true,
min: 0,
max: 100,
ticks: { stepSize: 10 }
}
}
}
});
// Fetch and update data
function fetchWeatherData() {
fetch('/data')
.then(response => response.json())
.then(data => {
document.getElementById('weather').innerHTML = `
<div class='data-row'>
<div class='data-card'>Temp: ${data.temperature}°C Humidity: ${data.humidity}%</div>
</div>
<div class='data-row'>
<div class='data-card'>Pressure: ${data.pressure} mbar</div>
</div>
<div class='data-row'>
<div class='data-card'>AQI: ${data.aqi} Rainfall: ${data.rainfall ? 'Yes' : 'No'}</div>
</div>`;
let time = new Date().toLocaleTimeString();
// Add new data points
combinedChart.data.labels.push(time);
combinedChart.data.datasets[0].data.push(data.temperature); // Temperature
combinedChart.data.datasets[1].data.push(data.humidity); // Humidity
// Keep only the last 10 points
if (combinedChart.data.labels.length > 10) {
combinedChart.data.labels.shift();
combinedChart.data.datasets[0].data.shift();
combinedChart.data.datasets[1].data.shift();
}
combinedChart.update();
});
}
setInterval(fetchWeatherData, 1000);
</script>
</body>
</html>
)rawliteral";
// Send the entire HTML content in one go
client.print(html);
} This send_web_page() function is responsible for generating and sending an HTML-based weather dashboard to a connected client(Browser) over WiFi.
How the Webpage HTML Code Works
1.HTML Structure
Displays weather data cards (temperature, humidity, pressure, AQI, rainfall).
It includes a graph for plotting temperature and humidity using Chart.js.
2.CSS Styling
Light theme with responsive layout and modern styling.
3.JavaScript
Fetches weather data from the Arduino local web server (/data endpoint) i.e, JSON data serve path “https://Arduino_IP _Address/data” every second.
Updates the data cards and appends new data points to the graphs dynamically.
4. Graphs
Uses Chart.js to create real-time line charts for temperature and humidity.
Keeps only the last 10 data points visible.
Overall, this function creates a real-time weather dashboard with dynamic weather data and interactive graphs, using HTML, CSS, JavaScript, and Chart.js.
You can also able to customize this webpage by editing the HTML Code to unleash your Creativity. But make sure your code fetches the weather data from the JSON endpoint/data.
run_local_webserver()
This function activates the local webserver to serve both the webpage and live JSON data.
void run_local_webserver(){
 WiFiClient client = server.available();
 if (client) {
   String request = client.readStringUntil('\r');
   client.flush();
   if (request.indexOf("GET / ") != -1) {
     send_web_page(client);
   } else if (request.indexOf("GET /data") != -1) {
     send_json_data(client);
   }
   client.stop();
 }
}
The run_local_webserver() function handles incoming HTTP requests on the Arduino web server and responds accordingly. Note that it only responds to the client, which gets connected to the same network where the Arduino is connected.
Let’s consider the scenario,
Whenever the client requests access on “http://ARDUINO_IP_ADDRESS/” or “http://ARDUINO_IP_ADDRESS”, then it makes a call on the send_web_page() function to serve the Dynamic weather dashboard web page to the requested client.
Whenever the client requests access on “http://ARDUINO_IP_ADDRESS/data”, it makes a call on the send_json_data() function to send the weather data in JSON format to the requested client.

Flash The Code into Arduino
I hope you understand the working logic of the above code. Let’s upload this code into Arduino to see it working in action.
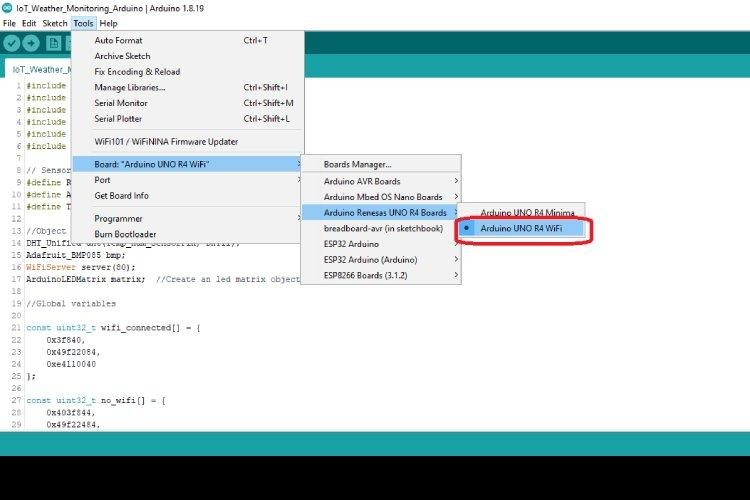
Before flashing the code, we want to make sure that, board is selected properly. In our case, it’s Arduino UNO R4 WiFi Board.
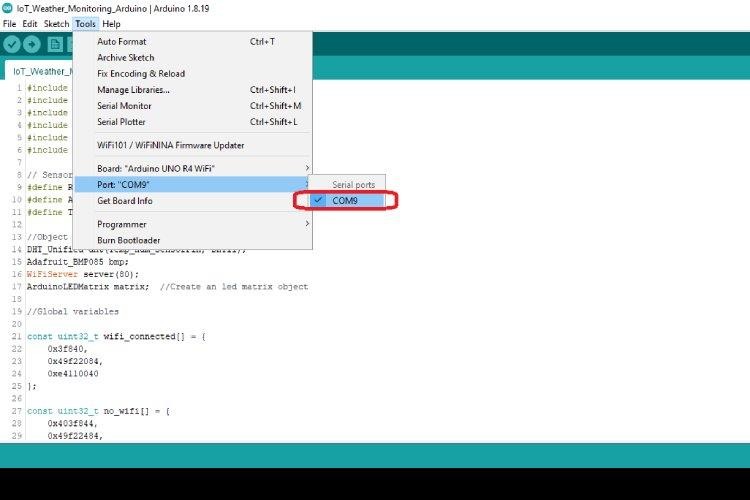
After that we want to correct serial port, that is used by Arduino UNO R4 WiFi for programming. If you see the Port Option is greyed Out. Then check out this tutorial Arduino not Working? Tips to troubleshoot the board.
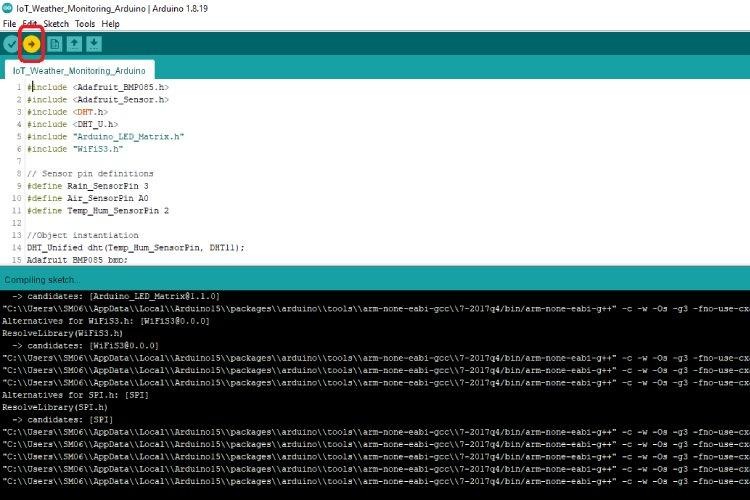
Let’s finally upload the code into Arduino by clicking the Upload button present on the Arduino IDE, as shown above.
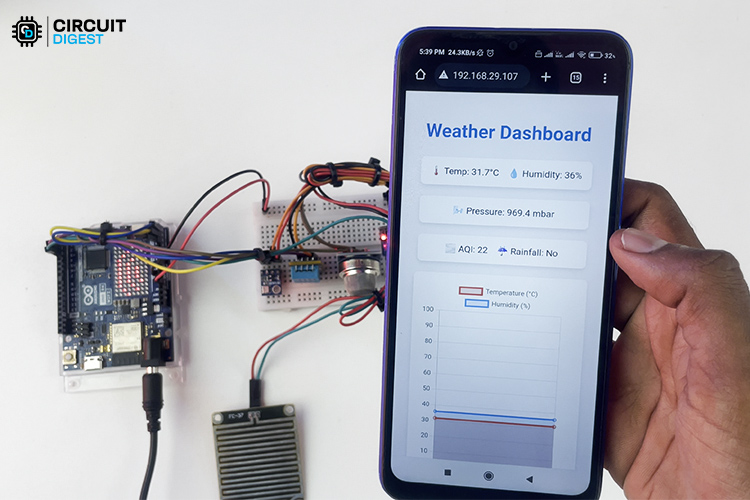
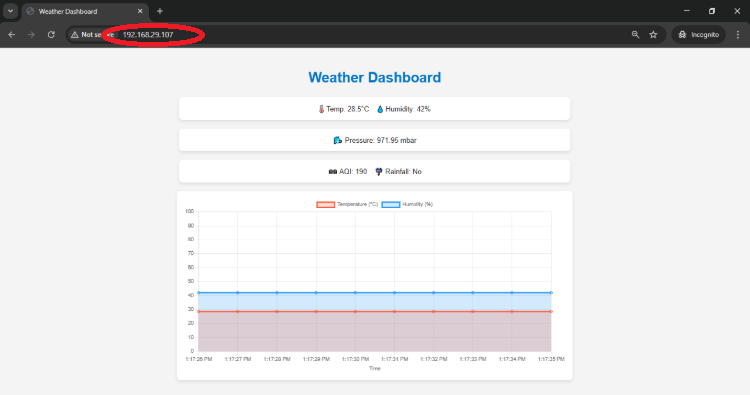
Working Demonstration of IoT Weather Monitoring System
Below, you can find the Working demonstration of the Arduino Weather monitoring system, where it collects the external environmental parameters like Temperature, Humidity, Rainfall status, Atmospheric pressure, Air Quality Index, and make it visible on the Locally Served Webpage.
GitHub Repository with Code and Circuit


Similar IoT-Based Weather Monitoring Projects
We have built several interesting IoT-based Weather Monitoring Projects using different sensors and microcontrollers. If you want to explore those projects, links are given below.

IoT Weather Station using NodeMCU: Monitoring Humidity, Temperature and Pressure over Internet
Build an IoT-based weather station using ESP12E NodeMCU to monitor temperature, humidity, and pressure, displaying real-time data on a web server accessible over the Internet.

Interfacing DHT11 Temperature & Humidity Sensor with STM32F103C8
Learn how to interface the DHT11 temperature and humidity sensor with the STM32F103C8 (Blue Pill) board using the Arduino IDE. It displays real-time temperature and humidity readings on a 16x2 I2C LCD.

Live Temperature and Humidity Monitoring over Internet using Arduino and ThingSpeak
This IoT project monitors temperature and humidity using sensors and displays real-time data on the ThingSpeak cloud platform.

Real-Time Temperature and Humidity Monitoring Webserver with Raspberry Pi Pico W and DHT11 Sensor
Learn how to use Raspberry Pi Pico W and a DHT11 sensor to monitor temperature and humidity. The collected data is displayed in real-time on a local webserver hosted by the Pico W.
Complete Project Code
/*--------------------------------------------------------------
---------------------------Header Files-------------------------
----------------------------------------------------------------*/
#include <Adafruit_BMP085.h>
#include <Adafruit_Sensor.h>
#include <DHT.h>
#include <DHT_U.h>
#include "Arduino_LED_Matrix.h"
#include "WiFiS3.h"
/*-----------------------------------------------------------------------
-------------------------Sensor pin definition Macros-------------------
-------------------------------------------------------------------------*/
#define Rain_SensorPin 3
#define Air_SensorPin A3
#define Temp_Hum_SensorPin 2
/*-------------------------------------------------------------------------
--------------------------Object instantiation-----------------------------
--------------------------------------------------------------------------*/
DHT_Unified dht(Temp_Hum_SensorPin, DHT11);
Adafruit_BMP085 bmp;
WiFiServer server(80);
ArduinoLEDMatrix matrix;
/*--------------------------------------------------------------------
-------------------------Global variables----------------------------
----------------------------------------------------------------------*/
//Bring WiFi Connected Symbol on LED Matrix
const uint32_t wifi_connected[] = {
0x3f840,
0x49f22084,
0xe4110040
};
//Bring WiFi Disconnrcted Symbol on LED Matrix
const uint32_t no_wifi[] = {
0x403f844,
0x49f22484,
0xe4110040
};
//SSID & PASSWORD of LAN Router
char ssid[] = "Semicon Media";
char pass[] = "XXXXXXXXXXXXX";
//Variables to hold weather data from sensors
float temperature = 0.0, humidity = 0.0, pressure = 0.0;
int AQI = 0, rainfall = 0;
//Flag variable for storing last sensor data update time and last wifi connectivity checking time
unsigned long lastSensorUpdate = 0;
unsigned long lastWiFiCheck = 0;
/*---------------------------------------------------------------------
-----------------User Defined Functions--------------------------------
---------------------------------------------------------------------------*/
//Function for making Arduino to connect to the WiFi Network
void wifi_connect(){
if (WiFi.status() == WL_NO_MODULE) {
Serial.println("Communication with WiFi module failed!");
matrix.loadFrame(no_wifi);
while (true);
}
Serial.print("Connecting to WiFi...");
matrix.loadSequence(LEDMATRIX_ANIMATION_WIFI_SEARCH);
matrix.play(true);
delay(6000);
while (WiFi.begin(ssid, pass) != WL_CONNECTED) {
Serial.print(".");
delay(1000);
}
matrix.loadFrame(wifi_connected);
Serial.println("\nConnected to WiFi!");
Serial.print("IP Address: ");
Serial.println(WiFi.localIP());
}
//Function for making Arduino to reconnect to the WiFi Network, after getting disconnected
void wifi_reconnect(){
Serial.println("Wifi Reconnecting........");
matrix.loadFrame(no_wifi);
delay(6000);
wifi_connect();
}
//Functiom to read the weather data from the collection of sensors
void read_sensor_data(){
sensors_event_t event;
dht.temperature().getEvent(&event);
temperature = event.temperature;
dht.humidity().getEvent(&event);
humidity = event.relative_humidity;
pressure = bmp.readPressure() / 100.0; // Convert Pa to mbar
int mq135Raw = analogRead(Air_SensorPin);
float mq135PPM = mq135Raw * (5.0 / 1023.0) * 20.0; // Convert raw value to PPM
AQI = map(mq135PPM, 0, 500, 0, 300); // Convert PPM to AQI (adjust as needed)
rainfall = digitalRead(Rain_SensorPin) == HIGH ? 0 : 1;
}
//Function to send JSON data to the requested Web client Device(Browser)
void send_json_data(WiFiClient &client) {
client.println("HTTP/1.1 200 OK");
client.println("Content-Type: application/json");
client.println("Connection: close");
client.println();
String json = "{\"temperature\":" + String(temperature) +
",\"humidity\":" + String(humidity) +
",\"pressure\":" + String(pressure) +
",\"aqi\":" + String(AQI) +
",\"rainfall\":" + String(rainfall) + "}";
client.println(json);
}
//Function to send Dynamic weather dashboard webpage to the requested web client(Browser)
void send_web_page(WiFiClient &client) {
// Send HTTP headers
client.println("HTTP/1.1 200 OK");
client.println("Content-Type: text/html");
client.println("Connection: close");
client.println();
// Use raw string literal for HTML content
const char* html = R"rawliteral(
<!DOCTYPE html>
<html lang='en'>
<head>
<meta charset='UTF-8'>
<meta name='viewport' content='width=device-width, initial-scale=1.0'>
<title>Weather Dashboard</title>
<style>
body { font-family: Arial, sans-serif; background: #f4f4f4; color: #333; text-align: center; padding: 20px; }
h1 { font-size: 2rem; color: #0077cc; }
.container { max-width: 900px; margin: auto; }
.data-container { display: flex; flex-direction: column; gap: 10px; }
.data-row { display: flex; justify-content: space-between; align-items: center; }
.data-card { background: #fff; padding: 15px; border-radius: 8px; box-shadow: 0 4px 8px rgba(0, 0, 0, 0.1); flex: 1; margin: 5px; text-align: center; }
.graph { background: #fff; padding: 15px; border-radius: 8px; box-shadow: 0 4px 8px rgba(0, 0, 0, 0.1); margin-top: 15px; }
canvas { width: 100%; height: 400px; }
</style>
</head>
<body>
<h1>Weather Dashboard</h1>
<div class='container'>
<div id='weather' class='data-container'></div>
<div class='graph'><canvas id='combinedGraph'></canvas></div>
</div>
<script src='https://cdn.jsdelivr.net/npm/chart.js'></script>
<script>
const ctxCombined = document.getElementById('combinedGraph').getContext('2d');
// Create a single graph with both temperature and humidity
const combinedChart = new Chart(ctxCombined, {
type: 'line',
data: {
labels: [],
datasets: [
{
label: 'Temperature (°C)',
data: [],
borderColor: '#ff5733',
backgroundColor: 'rgba(255, 87, 51, 0.2)',
fill: true,
tension: 0.4,
pointRadius: 3
},
{
label: 'Humidity (%)',
data: [],
borderColor: '#2196f3',
backgroundColor: 'rgba(33, 150, 243, 0.2)',
fill: true,
tension: 0.4,
pointRadius: 3
}
]
},
options: {
responsive: true,
maintainAspectRatio: false,
animation: false,
scales: {
x: { title: { display: true, text: 'Time' } },
y: {
beginAtZero: true,
min: 0,
max: 100,
ticks: { stepSize: 10 }
}
}
}
});
// Fetch and update data
function fetchWeatherData() {
fetch('/data')
.then(response => response.json())
.then(data => {
document.getElementById('weather').innerHTML = `
<div class='data-row'>
<div class='data-card'> Temp: ${data.temperature}°C Humidity: ${data.humidity}%</div>
</div>
<div class='data-row'>
<div class='data-card'> Pressure: ${data.pressure} mbar</div>
</div>
<div class='data-row'>
<div class='data-card'> AQI: ${data.aqi} Rainfall: ${data.rainfall ? 'Yes' : 'No'}</div>
</div>`;
let time = new Date().toLocaleTimeString();
// Add new data points
combinedChart.data.labels.push(time);
combinedChart.data.datasets[0].data.push(data.temperature); // Temperature
combinedChart.data.datasets[1].data.push(data.humidity); // Humidity
// Keep only the last 10 points
if (combinedChart.data.labels.length > 10) {
combinedChart.data.labels.shift();
combinedChart.data.datasets[0].data.shift();
combinedChart.data.datasets[1].data.shift();
}
combinedChart.update();
});
}
setInterval(fetchWeatherData, 1000);
</script>
</body>
</html>
)rawliteral";
// Send the entire HTML content in one go
client.print(html);
}
//Function to run a local webserver on Arduino for handling client request
void run_local_webserver(){
WiFiClient client = server.available();
if (client) {
String request = client.readStringUntil('\r');
client.flush();
if (request.indexOf("GET / ") != -1) {
send_web_page(client);
} else if (request.indexOf("GET /data") != -1) {
send_json_data(client);
}
client.stop();
}
}
/*-----------------------------------------------------------------
-----------------------Setup Function------------------------------
------------------------------------------------------------------*/
void setup() {
Serial.begin(115200);
while (!Serial) {}
matrix.begin();
wifi_connect();
server.begin();
pinMode(Rain_SensorPin, INPUT);
pinMode(Air_SensorPin, INPUT);
dht.begin();
while (!bmp.begin()) {
Serial.println("BMP085 sensor not found, check wiring!");
}
}
/*-----------------------------------------------------------
-----------------Loop function-------------------------------
-------------------------------------------------------------*/
void loop() {
if (millis() - lastSensorUpdate >= 1000) {
lastSensorUpdate = millis();
read_sensor_data();
}
if(millis() - lastWiFiCheck >= 5000){
lastWiFiCheck = millis();
if(WiFi.status() != WL_CONNECTED){
wifi_reconnect();
}
}
run_local_webserver();
}